Ask ten pilots whether airplanes hold their value and you'll get ten different answers. One swears his airframe is worth more than he paid; another watched a brand-new airplane shed money the moment it left the factory; a third figures it all comes out in the wash. There's no settled wisdom here—just a lot of strongly held, conflicting opinions. So we did the obvious thing that's been almost impossible to do until now: we measured it, in honest, inflation-adjusted dollars.
But measuring it meant building something that didn't exist yet. Nobody keeps a clean ledger of what a 1972 Bonanza was worth back in 1972—the record is scattered, inconsistent, and decades cold. So we built the ledger ourselves: six decades of historical market records, 1960 through 2020, assembled into one connected dataset and converted to constant dollars so every year speaks the same language. Then we took our production model—the one that prices airplanes today—and, through transfer learning, taught it to read that history and reason backward in time. The result tracks the same make/models across booms, busts, fuel shocks, and three generations of owners. Most aircraft analysis is a snapshot of last quarter; this is the long arc—and as far as we know, it reaches further back than any aircraft valuation model before it.
We used it to answer one question: as an airplane ages, what is the typical real (inflation-adjusted) change in its value—and how much do individual airplanes vary around that typical path? Put precisely: for an airplane that stays in service and on the market—the one you actually own, maintain, and may someday sell—how does its real value move as it ages? The answer is clear: in real terms the typical airplane slowly loses value, fastest when it's young—but the spread between individual cohorts is enormous, which is exactly why every pilot's experience is different.
The decision to buy an airplane is one of the largest discretionary purchases most pilots ever make, and the financial story you tell yourself going in shapes everything—how much to stretch, when to sell, whether to overhaul or upgrade before listing.
For buyers, knowing the real depreciation curve means budgeting for the value you'll actually give back over your ownership. For sellers, it means setting expectations honestly. And for anyone weighing an airplane against other uses of the same capital, the real number is the only one that's an apples-to-apples comparison.
Here's the part that genuinely excites us. Pricing an airplane that's for sale today is one thing. But asking what that same airplane was worth on January 1st, 1985, or 1998, or 2011? That's a different kind of problem, and a genuinely hard one.
So we did something we're pretty proud of. We took our production valuation model—the one that prices airplanes today—and, using transfer learning, taught it to reason backward in time.
Here's why that approach, rather than starting from scratch. Training a fresh model directly on six decades of sparse, scattered archival records would be hopeless—there simply isn't enough clean historical data to learn, from nothing, everything that makes an airplane worth what it's worth. But our production model has already learned exactly that. Years of modern transactions taught it the deep structure of aircraft value: how engine time, avionics, airframe condition, seating, and the gravitational pull of a particular make/model's reputation all translate into dollars. That structure is the expensive part to learn, and it turns out to be remarkably stable across time—a low-time engine and a fresh panel commanded a premium in 1975 for the same reasons they do today.
What isn't stable is the price level and the world around it. So transfer learning lets us keep the hard-won structure and re-anchor only the parts that actually moved. We fine-tuned the model on a sample of deep archival pricing data, teaching it to project that same structural understanding onto the conditions that prevailed in each year: real fuel prices, the age and size of the fleet then flying, the macro backdrop, and the CPI level of the day. The base model already knew how airplanes are priced; the archival data taught it when.
The result is a longitudinal valuation model: a system that reconstructs what any aircraft would have likely been worth at any point in its life, using the conditions that actually prevailed in that moment. It effectively rebuilds the market of decades past—a time machine for the general aviation market.
We ran it across 90,080 point-in-time valuations, covering 682 distinct make/models, on an annual January-1 grid from 1960 through 2020. We converted every value to real dollars using a committed U.S. CPI-U index series—not month-over-month shortcuts—and measured the one-year real change between consecutive ages for each cohort. That produced 87,219 age-to-age value steps.
We pooled those steps by aircraft age and summarized the middle of the pack and the spread, overall and by segment, and tracked cumulative retention—how much of a new airplane's real value remains as it ages.
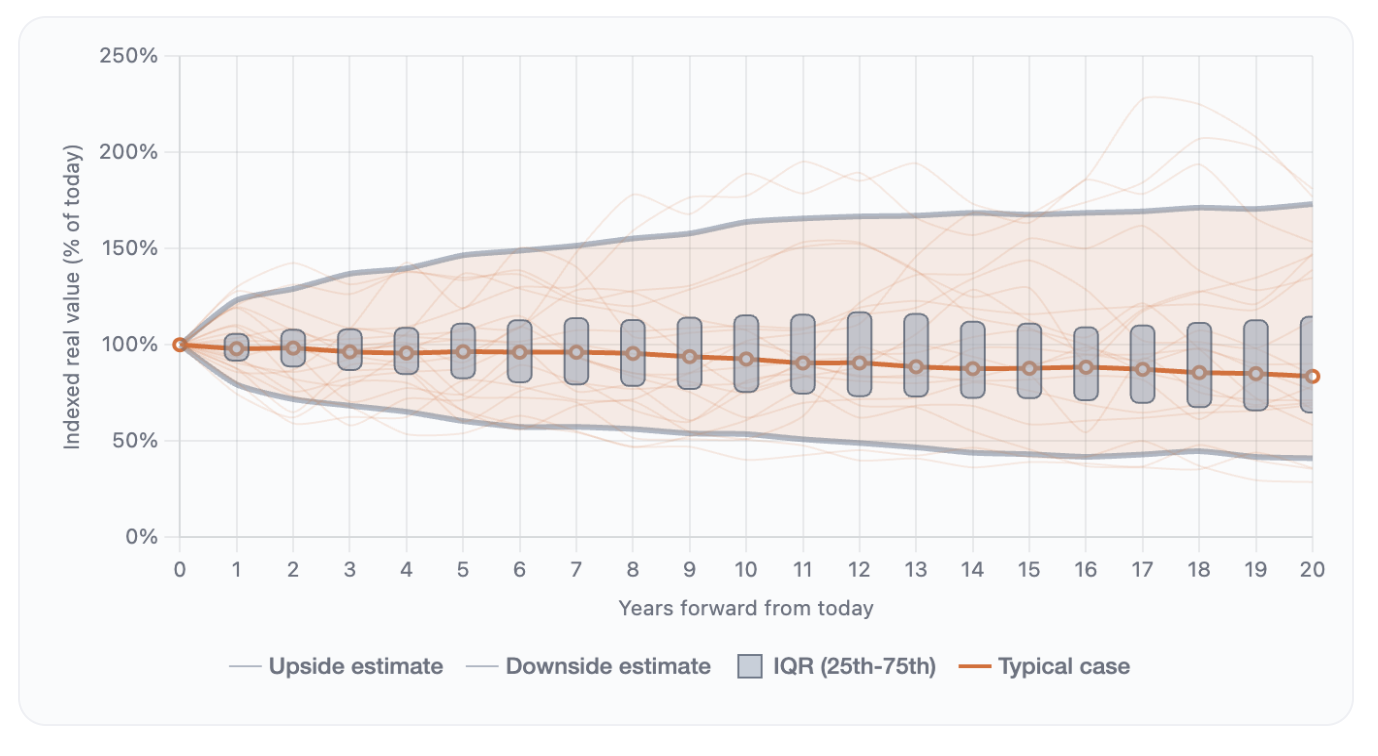
The interactive calculator: set your airplane's age, pick its segment, and watch the forward cone of real value play out—the typical path plus the full band of cohorts around it. Toggle real vs. nominal to see how much "holding value" is just inflation.
Across all aircraft, the median one-year real change in value is negative at 76 of the 80 ages we measured. The first year is the steepest—a median real drop of about 8.2%—and the decline continues, just more gently, as the airplane settles into middle age.
This matches what every owner feels intuitively: the bleed is fastest off the line and slows dramatically with age. An old airframe loses real value far more slowly than a new one.
Look again at that right-hand column. At every age, the gap between the unlucky 10% of cohorts and the lucky 10% is 30 to 40 percentage points wide. That width is not noise to be explained away—it is the finding.
It means all three of the stories you hear at the airport are true at once. Some cohorts genuinely climbed in real dollars—legacy pistons that came up cheap into a rising market. Many cratered—stretch for something brand-new and the real-dollar hit lands fast, exactly when it feels newest. And a large group looked flat on the sticker while quietly losing ground, because "the same price ten years later" is a real loss once the dollar shrinks underneath it. The typical airplane drifts down; a meaningful minority rise. "Does an airplane hold its value?" has no single answer because the airplane-to-airplane variation dwarfs the average trend.
This isn't one odd segment dragging the average around. The first-year real drop lands in the same neighborhood whether you fly pistons, turbines, or jets:
Stack the years up and the cumulative picture is sobering in constant dollars. Measured against a brand-new example, a typical single-engine piston holds about 77% of its real value at age 5, 61% at age 10, and 47% at age 20. Jets and turboprops trace nearly the identical path—roughly half of real value gone by the two-decade mark.
For context only—and it isn't a fair fight—the U.S. stock market returned a median of about +6.6% per year in those same real dollars over the period. An airplane is a capable tool that sometimes surprises you on resale, not an index fund with a propeller.
Before the accuracy check, the most important thing to understand about what we're measuring: the work product here is a change, not a price. A one-year real move is a ratio—this year's value over last year's—and any gap that sits at the same proportion from one year to the next simply divides out of it. So the shape of how value fades with age survives even where a single reconstructed price is only approximate. We're not quoting a tail number to the dollar; we're tracing a curve.
Reconstructing decades-old prices is only useful if it lands near reality, so we put it to the test. For every cell where we could line up the model's January-1 value against the median actual listing price for that same make, model-year, and calendar year, we measured how close it got.
Across thousands of these checks, the typical reconstruction lands within about 23% of the period benchmark—remarkable for prices set decades before any of the data we trained on existed. And lined up together, the reconstructions order the market almost exactly as it actually ranked: a rank correlation of 0.95, with an R² of 0.91 across prices spanning four orders of magnitude, from light singles to large-cabin jets. When the market was higher, the model reads higher—it's tracking history, not inventing it.
Every calibration cell—reconstructed value against the period benchmark, plotted log–log, the only honest scale when the fleet runs from thirty-thousand-dollar trainers to thirty-million-dollar jets; a linear axis would simply let the jets swallow every light-aircraft miss. Rank correlation across the cells: 0.95.
This is a deep-history reconstruction by design—a research instrument for the shape of the market across decades, not the live appraisal engine we use to price a specific tail number today. Two different tools for two different jobs, and this one is built to show the pattern, which is precisely where it shines.
For decades, every pilot has been right. The one who swears his airframe gained value, the one who watched a new airplane hemorrhage money the day he flew it home, the one who figures it all came out in the wash—they're not trading competing theories. They're each describing a different draw from the same deck. The fate of any one airplane is written by its production run and the stretch of history it aged through: a legacy piston that came up cheap into a rising market genuinely climbed; a brand-new airplane bought at the top genuinely cratered. Both are true. That's why the hangar argument never resolves—everyone's holding a real card, and no one can see the rest of the deck.
What nobody could see until now was the deck itself. The spread is so wide—30 to 40 points at every age—that in any short window it simply drowns the trend. You can't average your way out of it with last quarter's listings. You need a baseline long enough and deep enough that the idiosyncrasy cancels and the signal underneath surfaces. Six decades does that. And once the noise washes out, the trend is unmistakable for what may be the first time: in real dollars the typical airplane loses value, fastest when new, gently thereafter. The folklore was never wrong. It was just never powered to see past itself.
This is what we do at Windsock. The market hides its secrets in hard-to-reach places—decades of history too scattered for the legacy tools to make sense of. So we build the methods to dig them out, and then we do the part that matters: we show our work. We publish how accurately the model prices airplanes, walk through the assumptions and design choices behind it, and build in public as we go. You don't have to take our word for the number—you can check how often we get it right.
That's the idea behind Windsock: earned trust, not "trust us." Basic usage is free, and full reports cost a fraction of what the gatekeepers charge, because the market moves faster when everyone can see what an aircraft is worth. We take no commissions and no referral bonuses—our only incentive is getting the number right. Your data stays yours. And when we're wrong, we refund you. The map is free with any account: open the Price Index to see the trend and the spread for your segment, then put a number on your tail.