Here at Windsock, we're rebuilding aircraft valuations from the ground up — and that means dragging a few of the oldest habits out into the daylight. Today's habit: the way the legacy world prices engine time.
Ask almost anyone how an overhaul affects value and you'll get the same answer. Take the cost of the overhaul, divide it by the engine's TBO, and subtract that many dollars for every hour since major overhaul. A fixed dollar amount, every hour, all the way to run-out. The same straight line for a Cessna 152 and a Cirrus Vision Jet.
It's the dead reckoning of aircraft valuation. Plot a straight course, hold the heading, and assume the wind never changes. It's clean, it's teachable, and it fits on the back of a napkin.
It's also the best-fitting shape for only about 8 percent of the models we tested. And now, we've got the receipts.
Flat dollars-per-hour didn't survive because anyone proved the market behaves that way. It survived because it was easy.
Legacy valuation products needed a rule that could be printed in a guide, scribbled on a notepad, and run in a spreadsheet without a database behind it. Overhaul cost divided by TBO. One number. Subtract as you go. For forty years that workflow quietly trained the entire industry — buyers, sellers, brokers, lenders — to picture engine value as a straight line sliding downhill.
There's even a tidy story that makes it feel obviously true. Plenty of owners set money aside for the next overhaul linearly: a fixed reserve per flight hour, building toward the eventual bill. If your own checkbook fills up at a constant rate, it's natural to assume the market empties out the same way. Money in, money out, same slope.
Here's the problem. A reserve account is a budgeting tool. Market value is something else entirely — it's what an actual buyer will actually pay at a given engine time. And buyers don't pay by the hour. They pay for a fresh overhaul they don't have to think about, and they discount hard for a run-out engine they'll have to deal with next year.
Your reserve account flies a straight line. The market does not.
To check the straight line, we did the obvious thing: we actually tested it against the evidence.
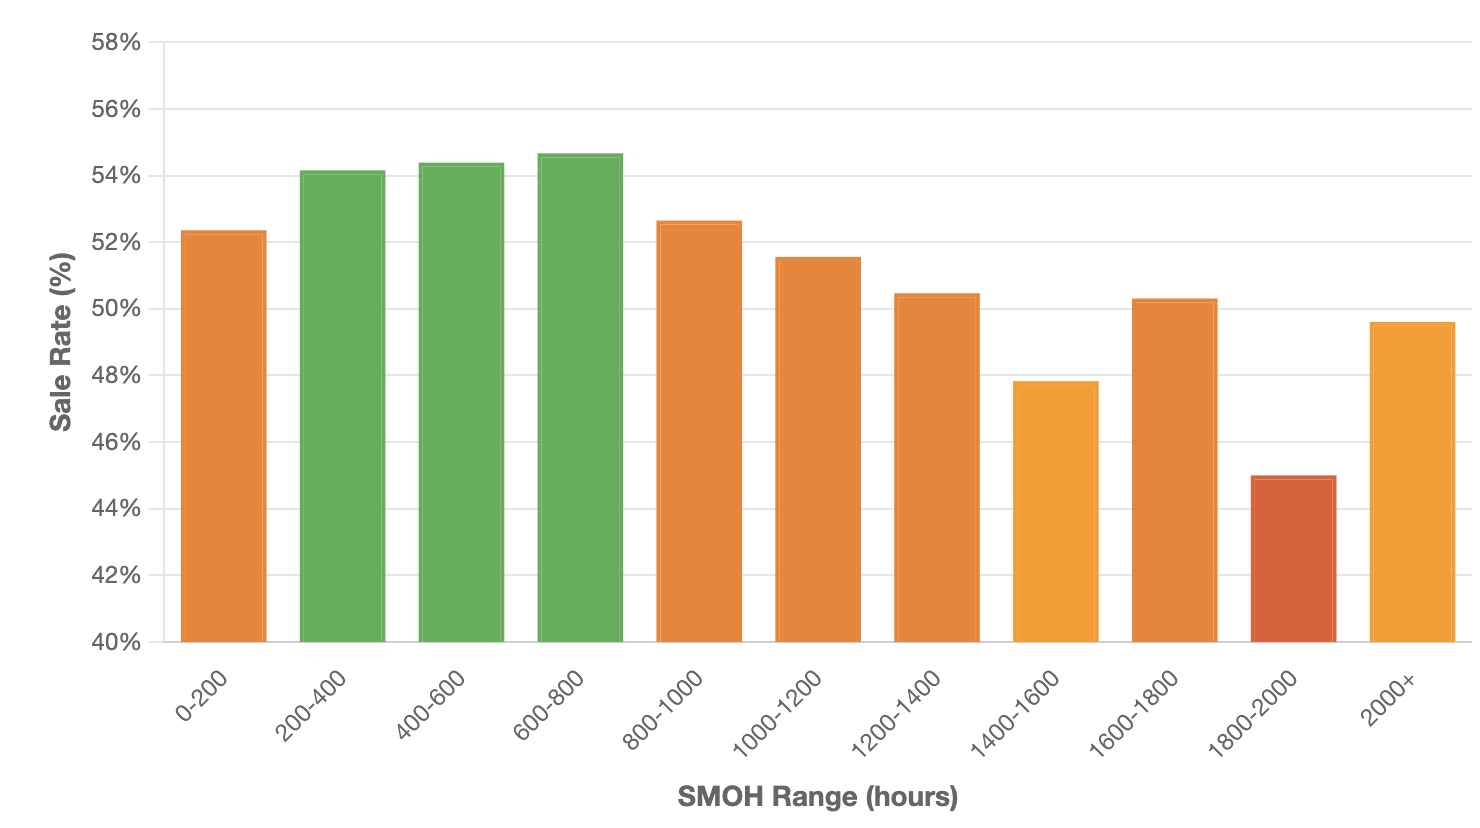
Take one model — a Cessna 172M, say. Compare its price, engine time, airframe hours, and age. Then ask the only question that matters: as the SMOH climbs, what actually happens to the price?
Hold airframe hours and age constant in the background - because they affect price too and we don't want them muddying the signal. What's left is the pure shape of the engine-time effect. And "shape" is the whole story, so we tested six competing theories of engine value:
We fit all six to the same listings and let the data pick the winner. The referee is a standard statistical test called AIC — which, stripped of the jargon, just rewards the shape that explains prices best without cheating by adding complexity. Lowest score wins. Whatever wins becomes that aircraft's "effective" market curve.
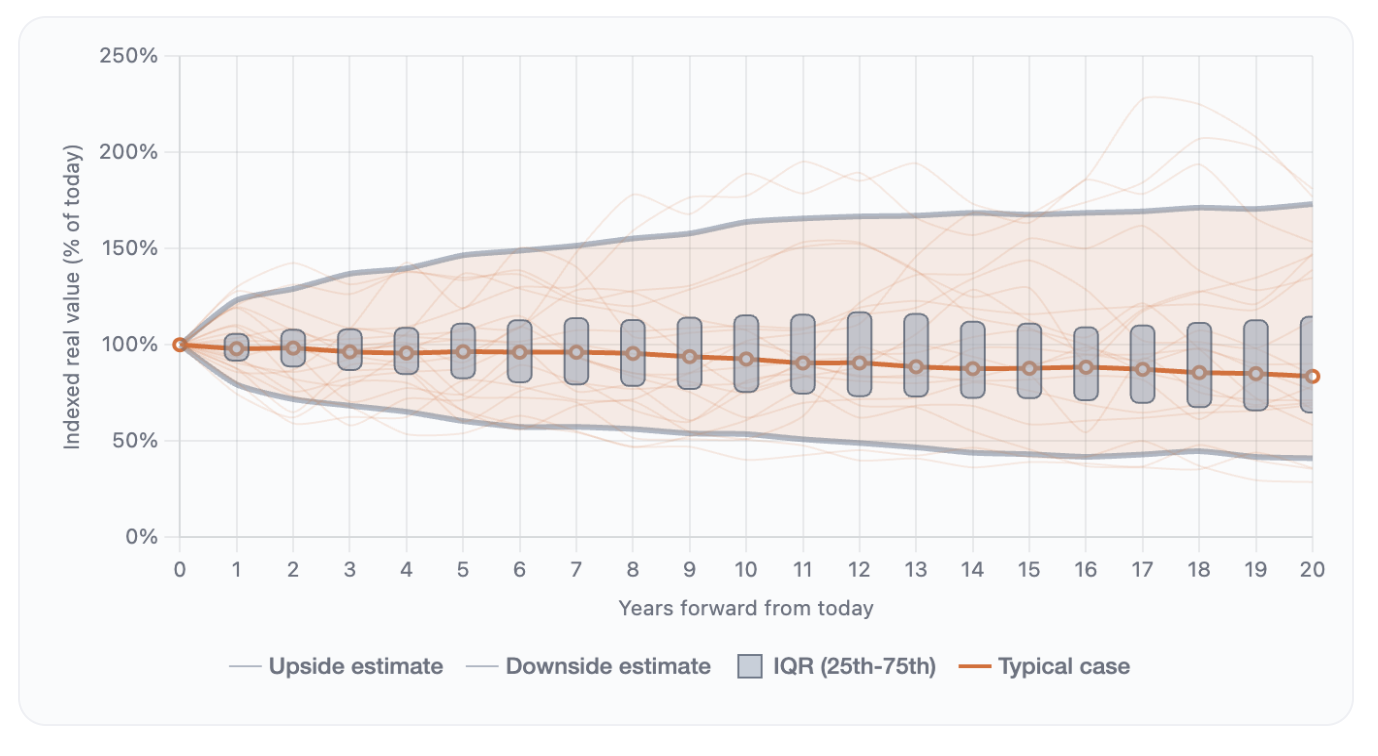
Then we translate the winning curve back into dollars, anchored at the model's median price at 1,000 hours, so we can hold it up next to the legacy straight line and see exactly where they part ways.
We ran that whole process across 285 of the most-traded piston and turboprop models in general aviation — every model with enough listings to fit honestly.
Click any pattern to see its equation, how often it wins, and how far the legacy straight line misses.
The straight line came in dead last.
Out of 285 models, exactly 23 — just 8.1 percent — actually depreciate in a straight line. The other 91.9 percent follow some non-linear shape of value. And it's not one rogue shape stealing the show; the market splits into two big camps that move in opposite directions.
About half the fleet (50.5 percent) is back-loaded — the exponential, cliff, and threshold crowd. These engines hold value comfortably through mid-life, then give it up fast as overhaul comes into view. The legacy straight line keeps shaving off the same flat amount per hour while the real market has already started running for the exits.
About a third (33.3 percent) does the exact opposite — the power-law crowd. Most of the value bleeds off in the first few hundred hours after overhaul, then the curve flattens out. Buyers pay a real premium for a fresh engine, and the straight line never sees it coming.
One model, one straight line, two markets pulling in opposite directions. No wonder the napkin math struggles.
So how much does this actually cost? We lined up the legacy formula against each model's real market curve at 1,500 hours — a typical mid-to-late engine time — across 270 models.
If the straight line were even roughly right, the errors would hover around zero. They don't.
That first number looks almost harmless, and that's exactly the trap. The straight line overshoots on some aircraft and undershoots on others, so the errors quietly cancel out in the average — like trimming an aircraft that's actually porpoising and calling it level flight. Look at the absolute size of the miss, though, and the truth comes out: north of twenty-six thousand dollars of divergence on a routine valuation between flat-line math and the best-fit market curve — a gap that, depending on the aircraft, can land on either the buyer or the seller.
Pick a pattern, slide the engine time, and watch the legacy straight line peel away from what the market actually pays.
Once you see it, the "why" is obvious.
A buyer shopping a fresh-overhaul trainer is buying peace of mind — no $40,000 surprise waiting around the corner — and they'll pay up for it. That's the power-law premium.
A buyer eyeing a high-performance twin with the engine clock pushing TBO is staring straight at that surprise, and they price it in hard. That's the cliff.
Neither of those buyers is doing constant dollars-per-hour arithmetic. They're pricing risk, timing, and the very real cash they'll write a check for. Engine value isn't a meter ticking down at a steady rate. It's a curve — sometimes front-loaded, sometimes back-loaded, almost never straight.
This isn't exotic economics. It's how every used-machinery market on earth behaves. The strange part was ever pretending a single straight line could stand in for all of it.
The standard legacy approach treats each engine hour as worth the same fixed dollar amount, on most aircraft, from fresh overhaul to run-out. It's simple, it's teachable, and across the fleet it's the best-fitting shape far less often than not.
285 models. Six possible shapes. Only 8.1 percent fly the straight line. Your reserve account fills up in a straight line, but the market has never paid that way — and now we can finally see exactly where that old math breaks.
This is the difference between dead reckoning and a modern GPS stack for the market. Curious what the curve looks like for your aircraft? Sign up and run a Windsock valuation — and start measuring your aircraft value the way the market actually sees it.